PDGF-BB
+41.8%
vs. reference average
0Ref 100%141.8%
Follitrix was evaluated against a reference GFC kit using quantitative ELISA analysis. Across all four growth-factor markers (PDGF-BB, IGF-1, EGF and VEGF-A), Follitrix showed a higher measured concentration in the tested samples.
The comparison uses the final concentration tables, excludes out-of-range values from averages, and uses the most reliable dilution for each analyte.
Reference-kit average is shown as 100% (the white marker). The Follitrix bar shows the measured concentration relative to that reference.
| Analyte | Reference = 100% | Follitrix | Measured difference |
|---|---|---|---|
| PDGF-BB | 100.0% | 141.8% | +41.8% |
| IGF-1 | 100.0% | 136.3% | +36.3% |
| EGF | 100.0% | 112.8% | +12.8% |
| VEGF-A | 100.0% | 109.1% | +9.1% |

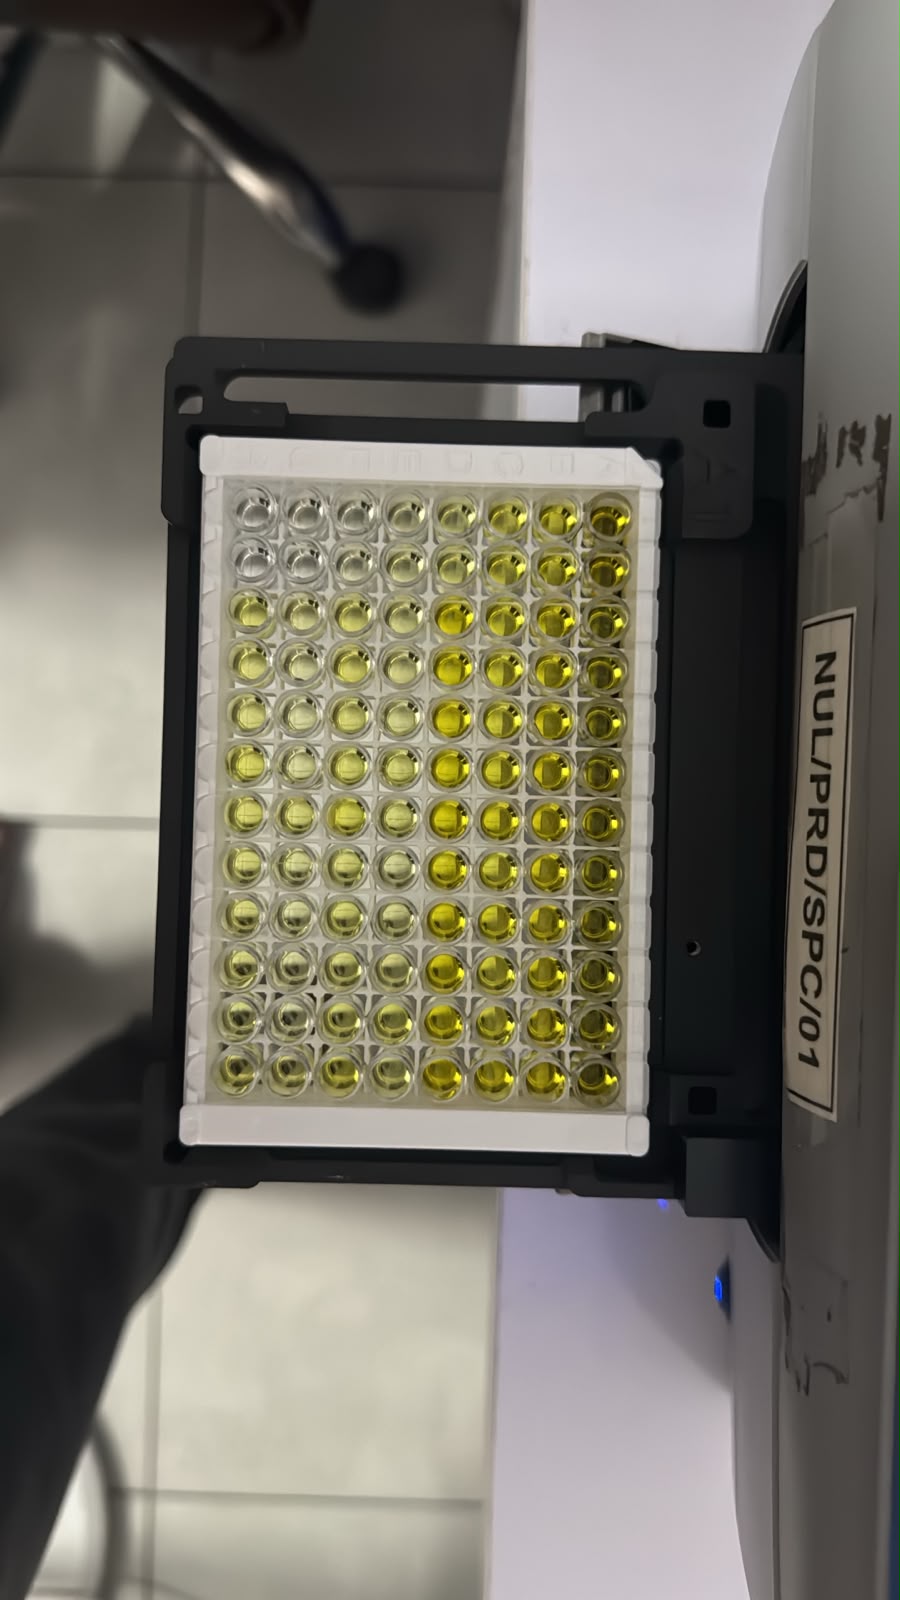
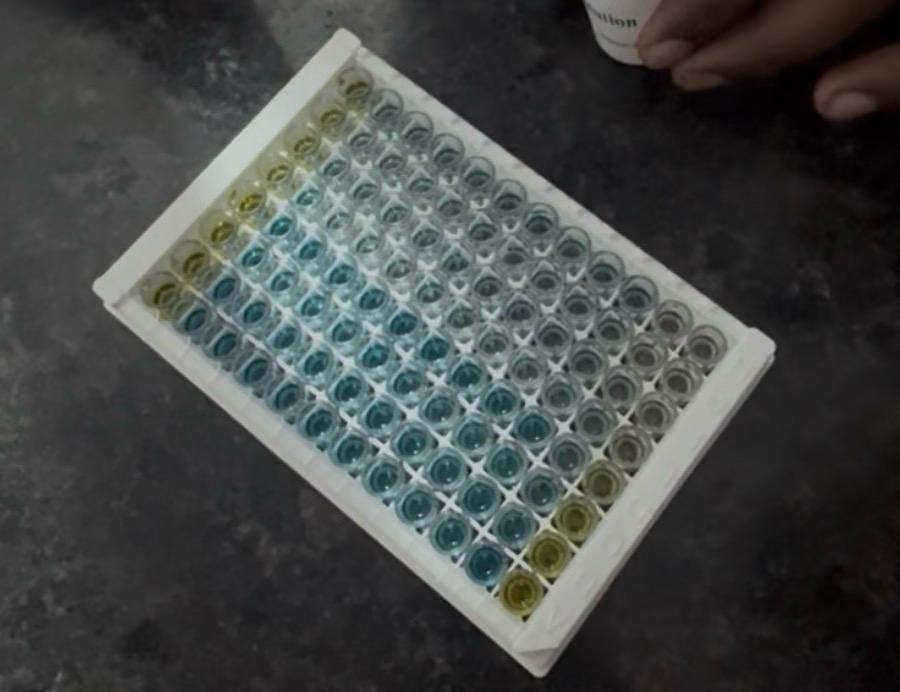
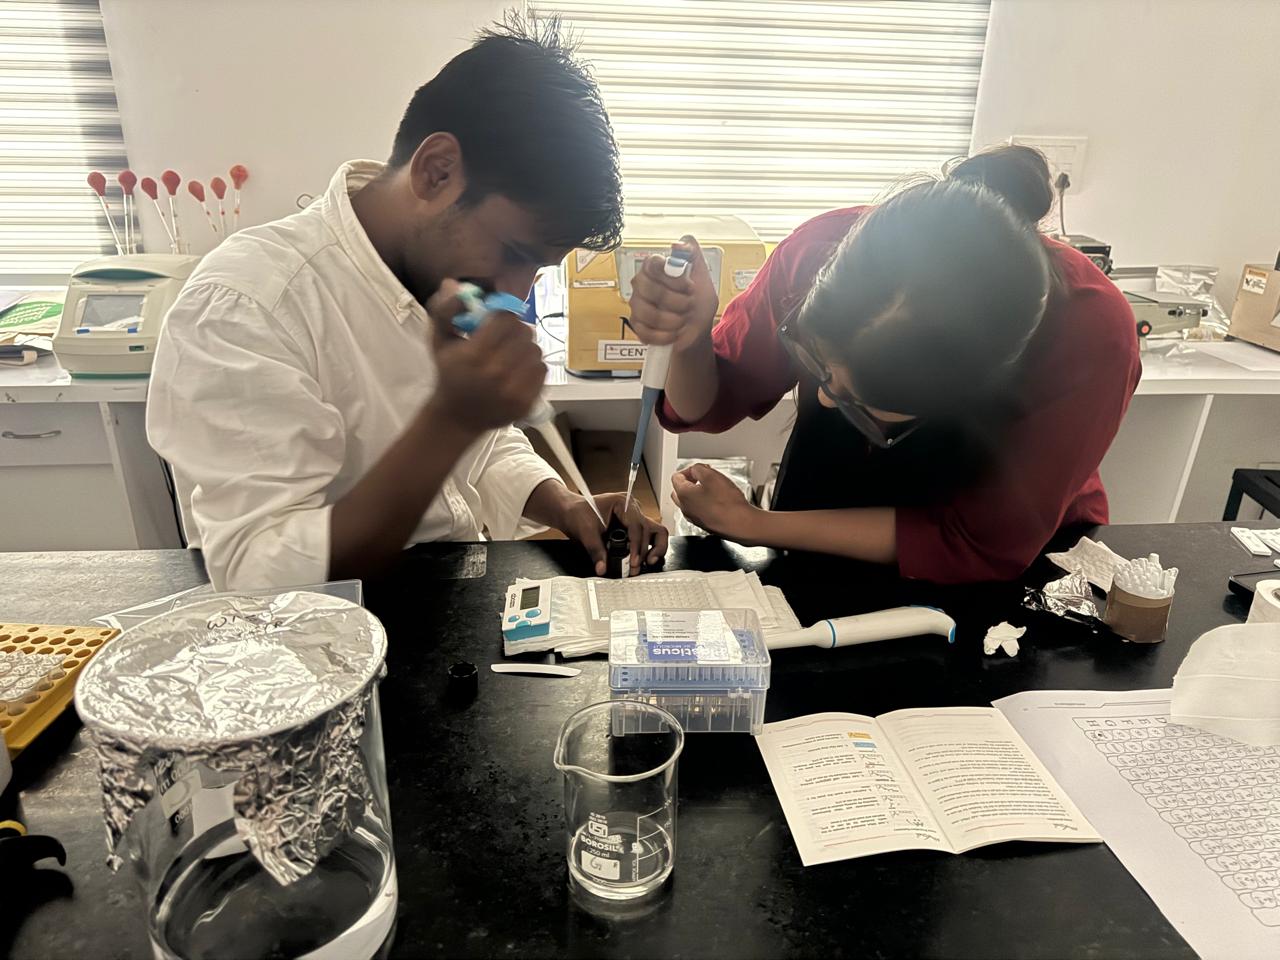
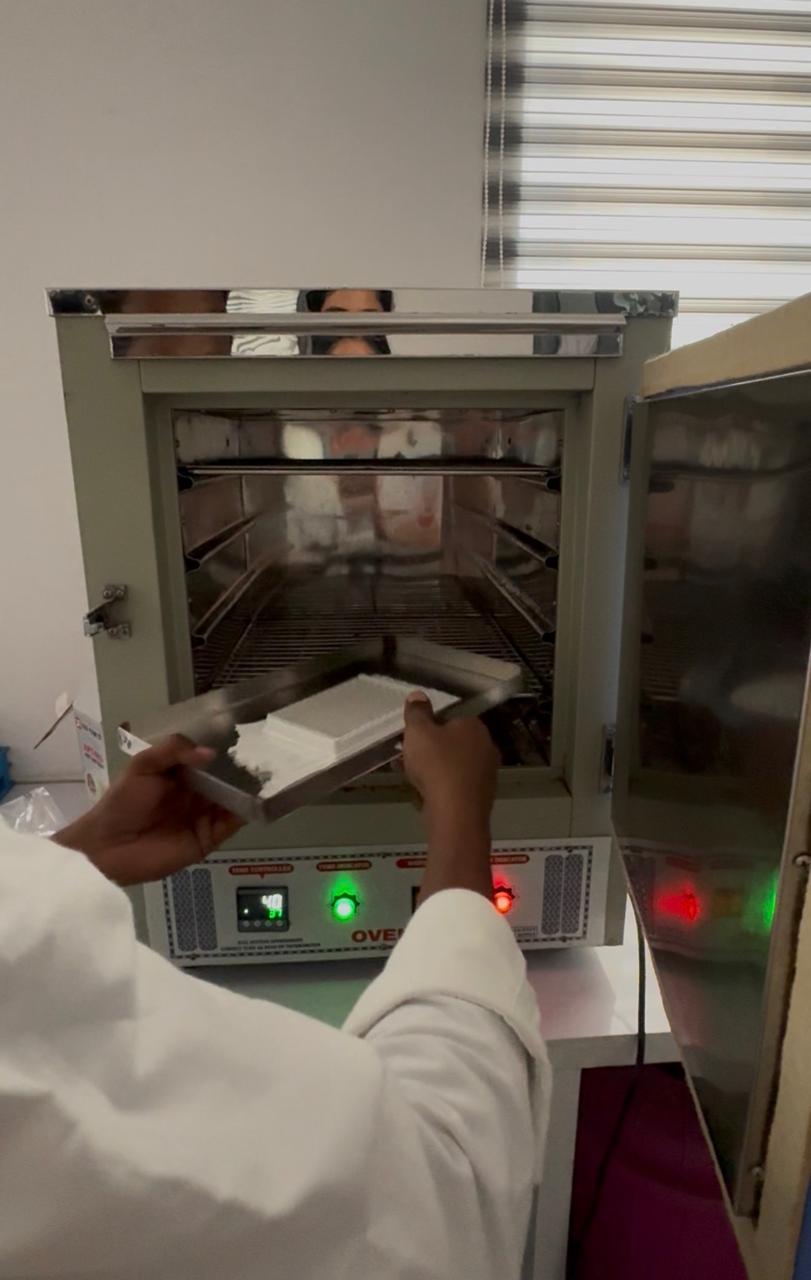
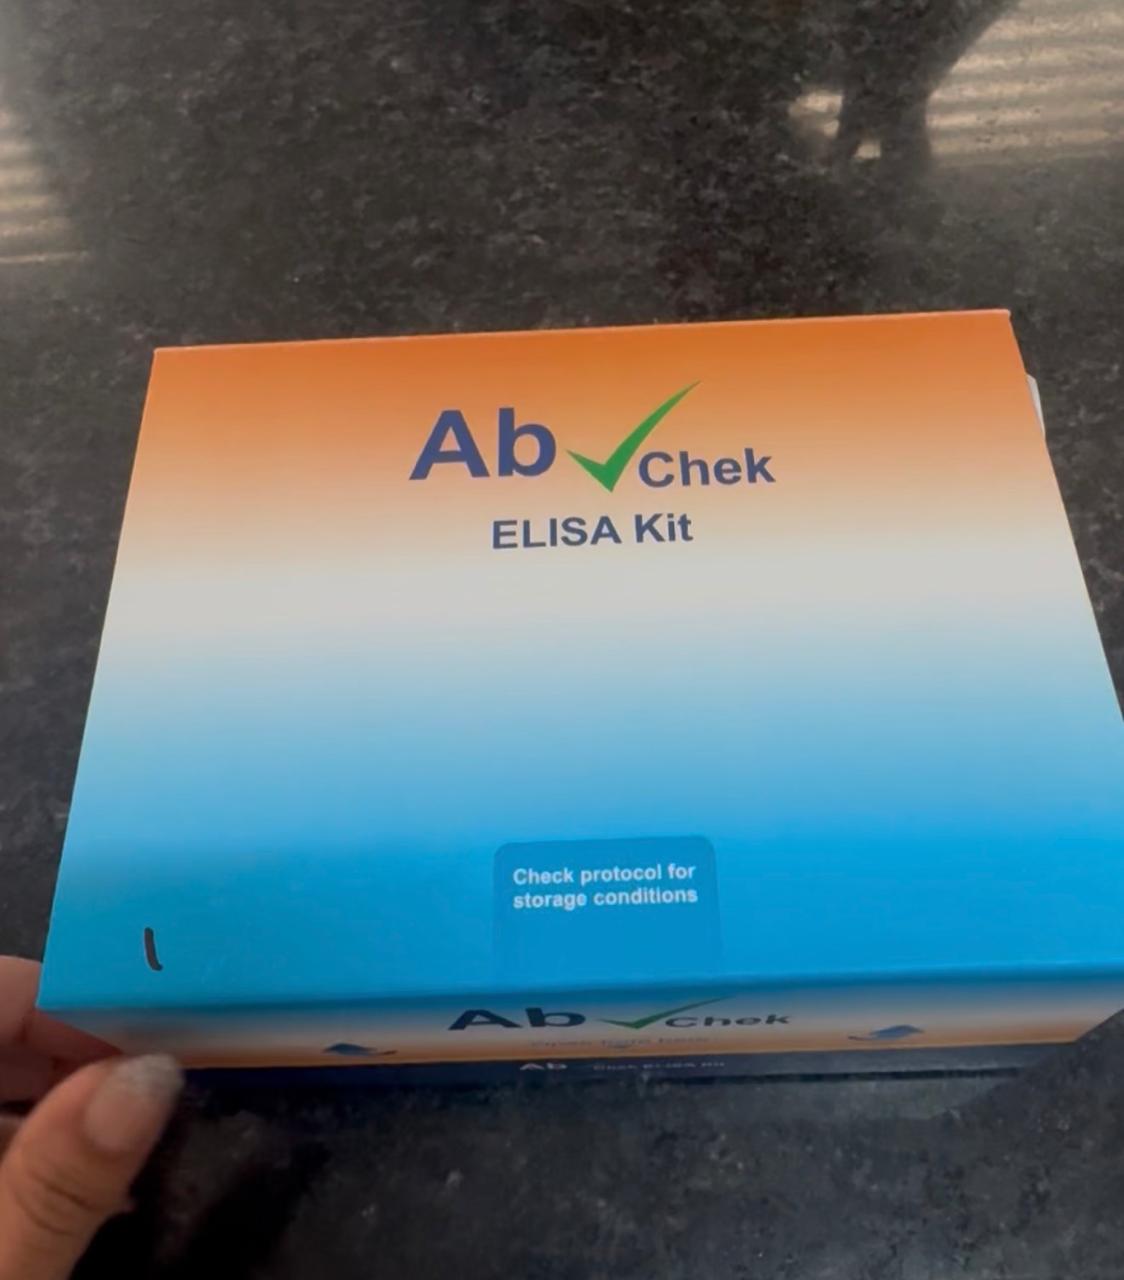
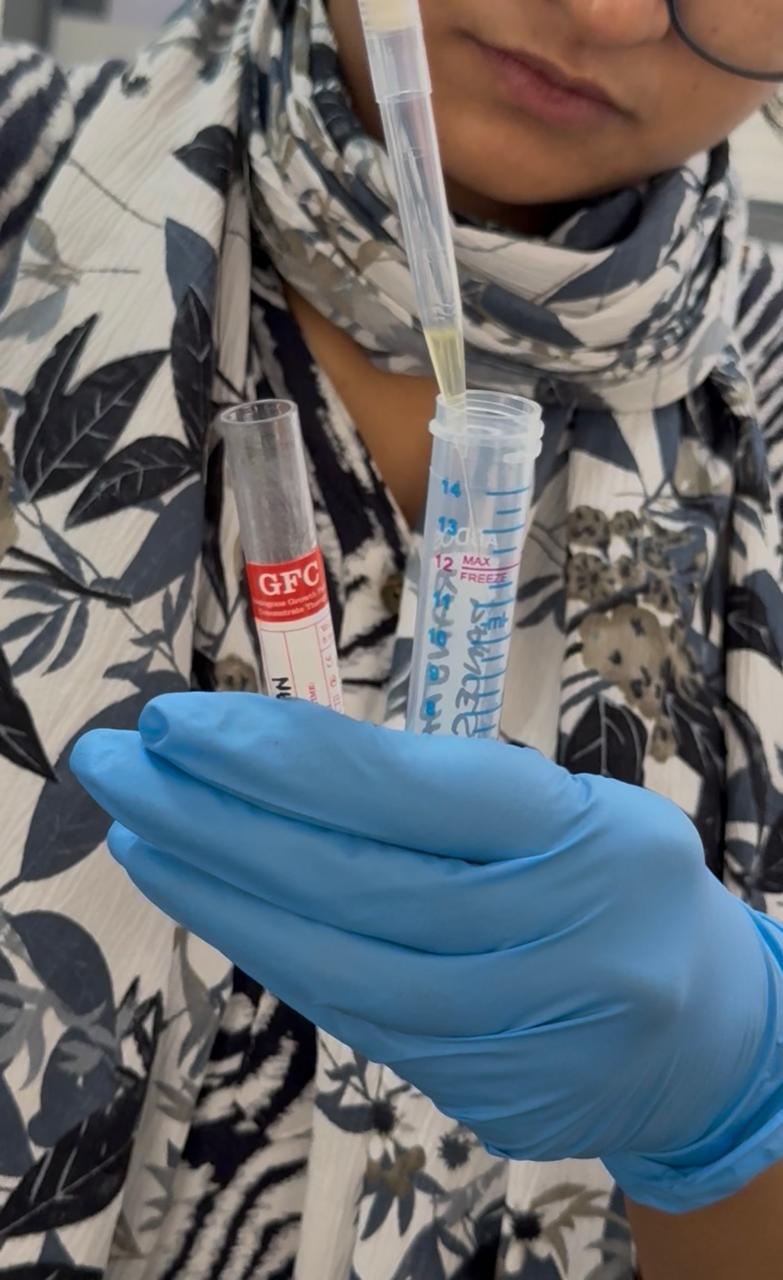
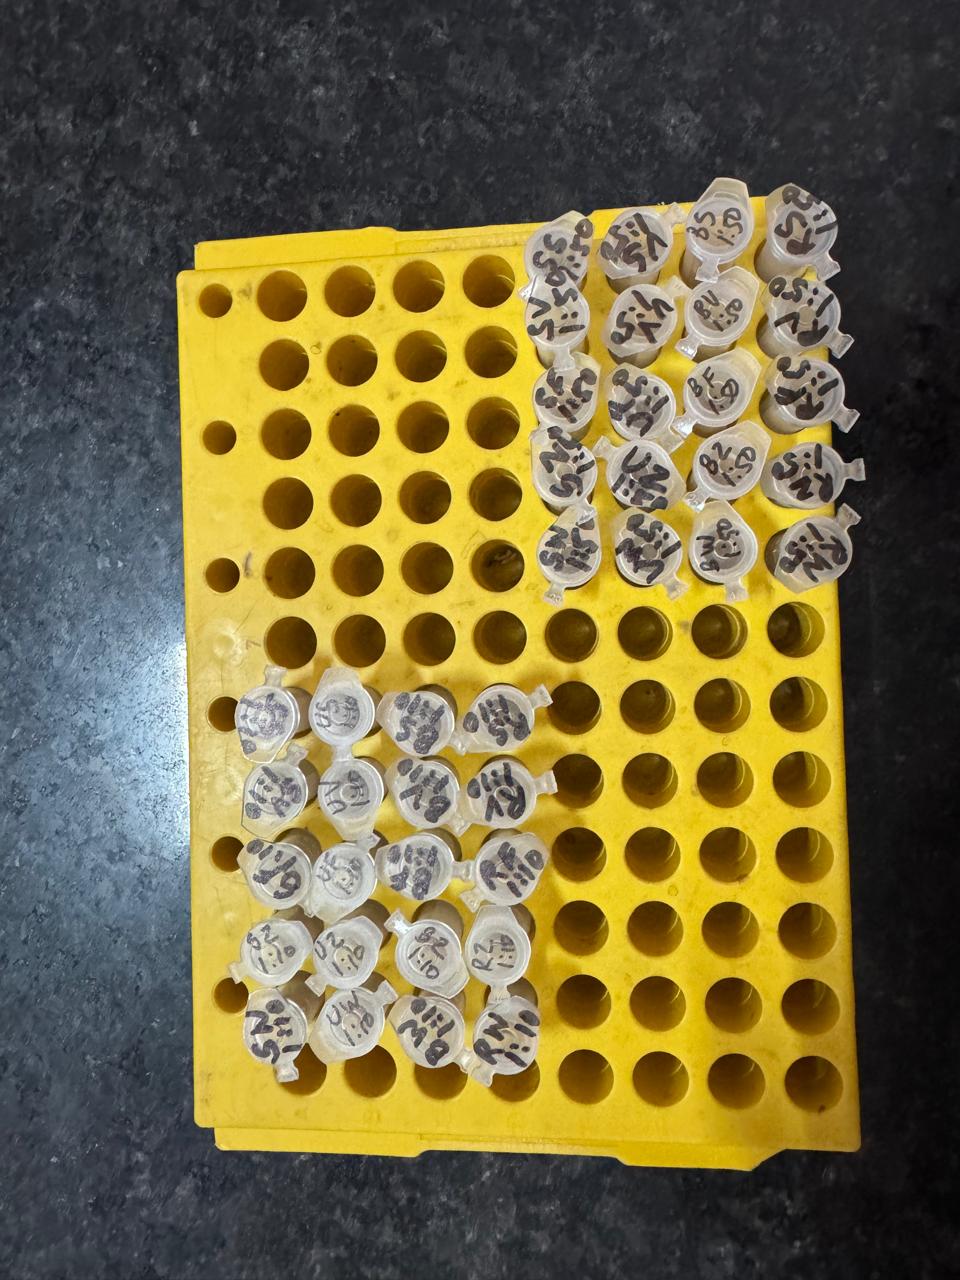
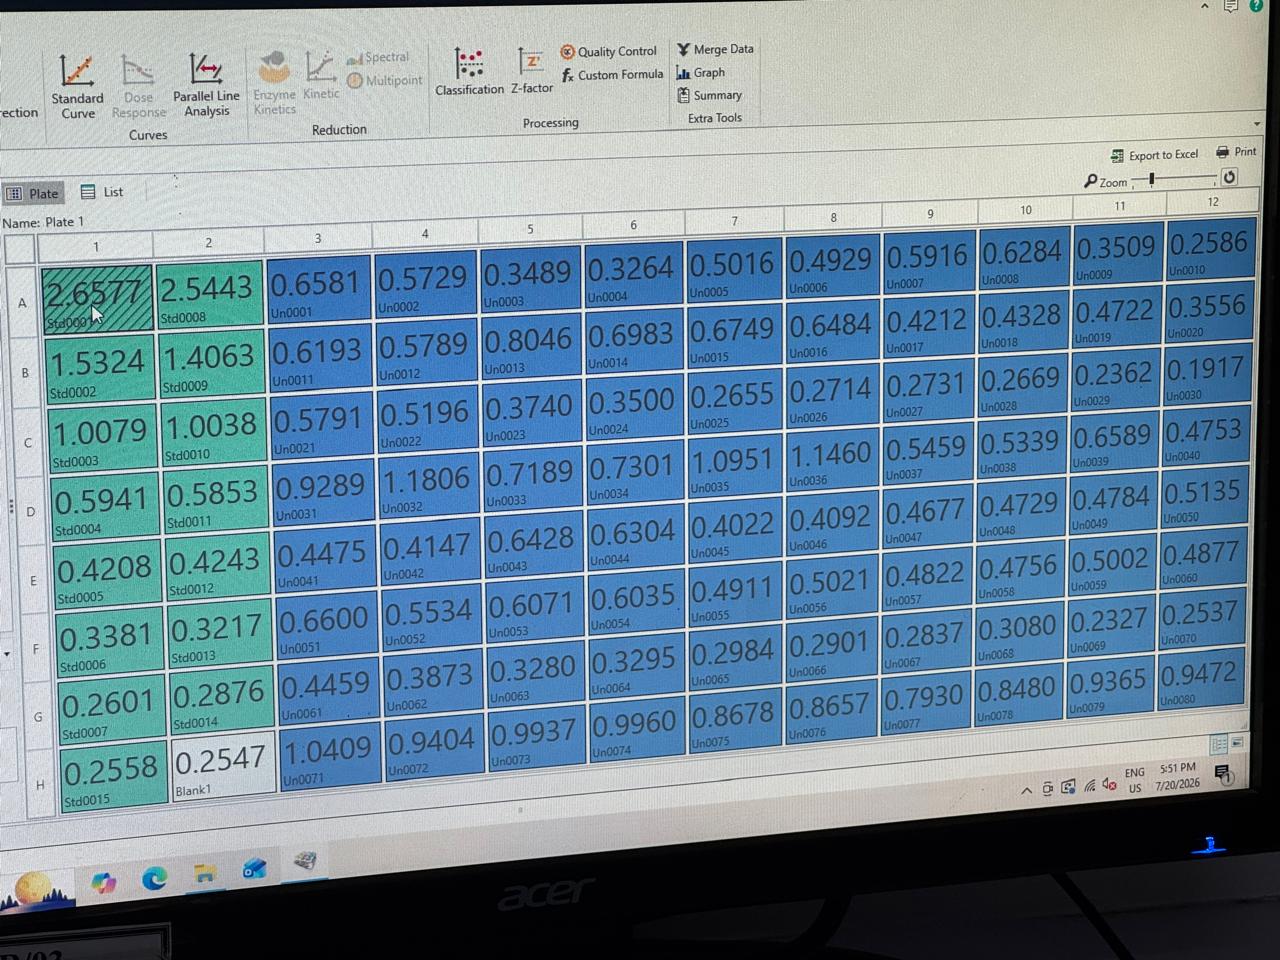
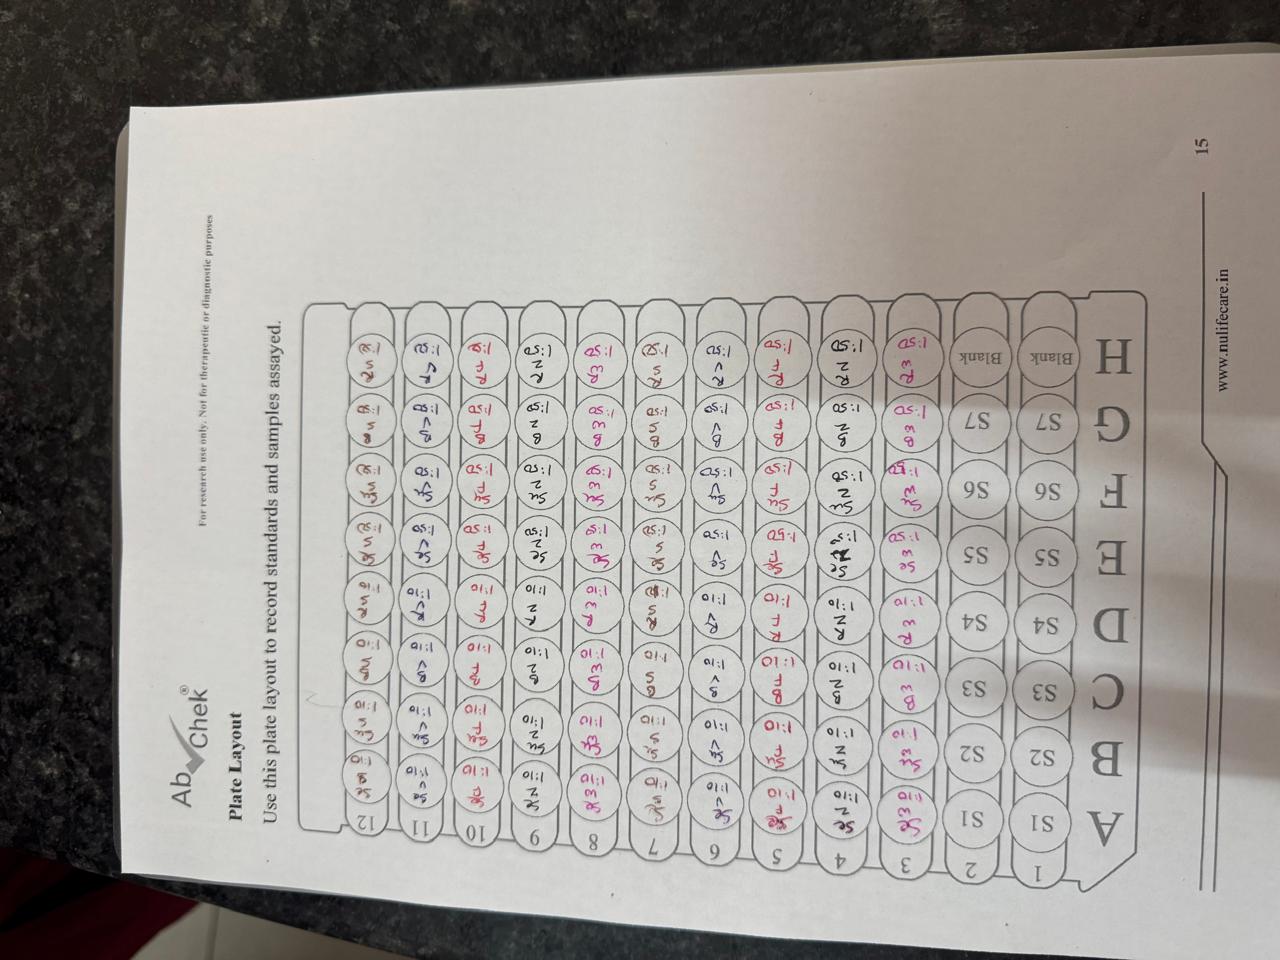
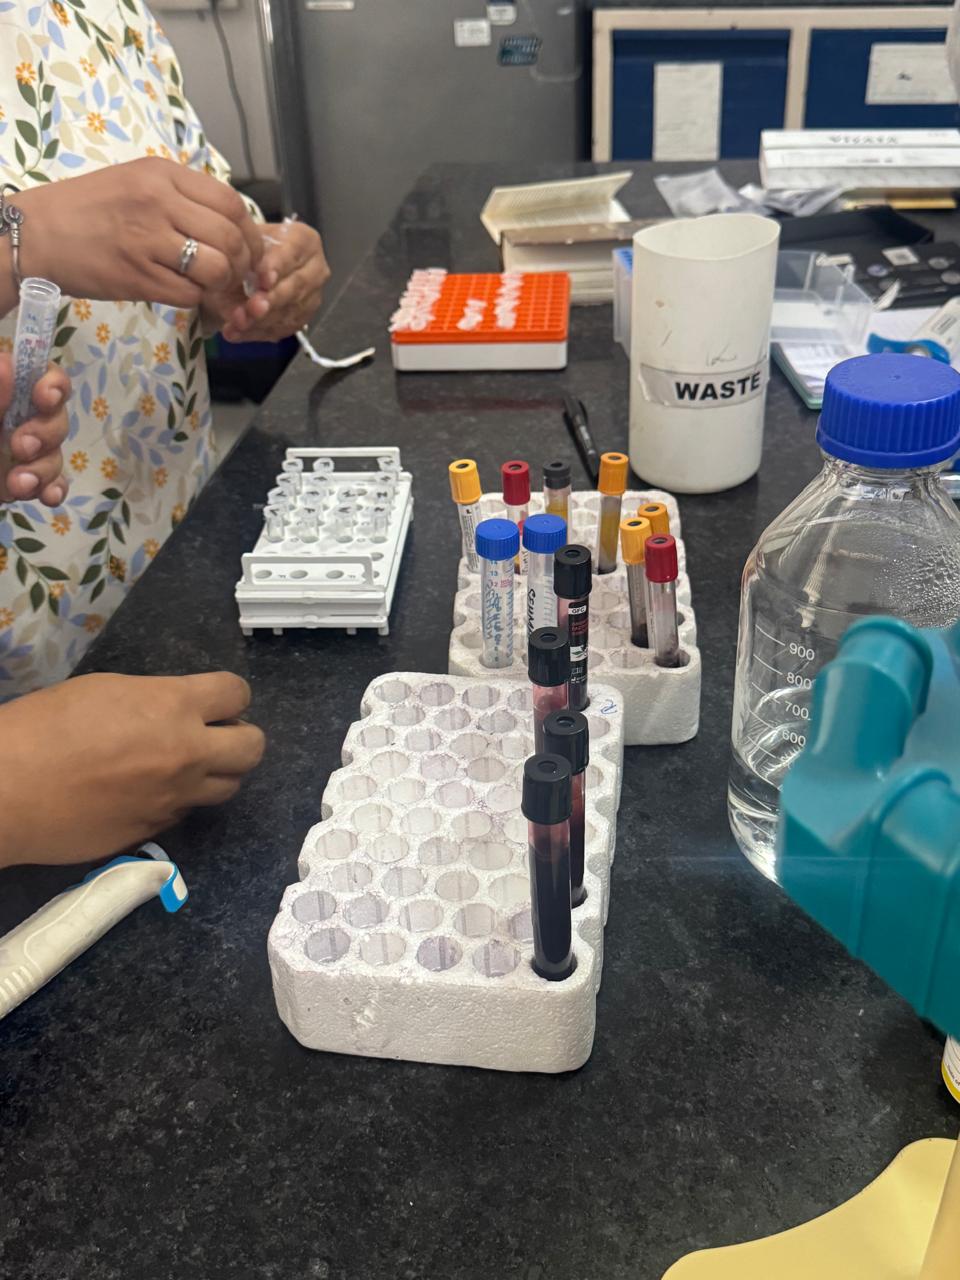
The supplied photographs document the comparative laboratory workflow, ELISA plates, sample handling and optical-density readings.
GFC samples prepared for comparative analytical testing.
Standards, controls and samples prepared for the selected growth-factor assays.
Optical-density measurements captured from the assay plates.
Four-parameter logistic standard curves used to convert corrected OD into concentration values.
All four tested analytes produced R² values above 0.995 for the standard curves.
Selected photographs from the testing process. Click any image to view it larger.